Types of Graphs
Why do we need to know what graphs look like?
- Graphs are used in various aspects of mathematics – but in the real world they can take on specific meanings
- For example a linear (straight line) graph could be the path a ship needs to sail along to get from one port to another
- An exponential graph (
) can be used to model population growth – for instance to monitor wildlife conservation projects
What are the shapes of graphs that we need to know?
- Recalling facts alone won’t do much for boosting your IGCSE Mathematics grade!
- But being familiar with the general shapes of graphs will help you quickly recognise the sort of maths you are dealing with and features of the graph a question may refer to
- Below the basic form of the five types of function (other than trig graphs) you need to recognise;
- linear (
format('truetype')%3Bfont-weight%3Anormal%3Bfont-style%3Anormal%3B%7D%3C%2Fstyle%3E%3C%2Fdefs%3E%3Ctext%20font-family%3D%22Times%20New%20Roman%22%20font-size%3D%2218%22%20font-style%3D%22italic%22%20text-anchor%3D%22middle%22%20x%3D%224.5%22%20y%3D%2216%22%3Ey%3C%2Ftext%3E%3Ctext%20font-family%3D%22math11b25dfe6f3d795a3d24c0528e8%22%20font-size%3D%2216%22%20text-anchor%3D%22middle%22%20x%3D%2218.5%22%20y%3D%2216%22%3E%3D%3C%2Ftext%3E%3Ctext%20font-family%3D%22math11b25dfe6f3d795a3d24c0528e8%22%20font-size%3D%2216%22%20text-anchor%3D%22middle%22%20x%3D%2235.5%22%20y%3D%2216%22%3E%26%23xB1%3B%3C%2Ftext%3E%3Ctext%20font-family%3D%22Times%20New%20Roman%22%20font-size%3D%2218%22%20font-style%3D%22italic%22%20text-anchor%3D%22middle%22%20x%3D%2247.5%22%20y%3D%2216%22%3Ex%3C%2Ftext%3E%3C%2Fsvg%3E) )
) - quadratic (
format('truetype')%3Bfont-weight%3Anormal%3Bfont-style%3Anormal%3B%7D%3C%2Fstyle%3E%3C%2Fdefs%3E%3Ctext%20font-family%3D%22Times%20New%20Roman%22%20font-size%3D%2218%22%20font-style%3D%22italic%22%20text-anchor%3D%22middle%22%20x%3D%224.5%22%20y%3D%2217%22%3Ey%3C%2Ftext%3E%3Ctext%20font-family%3D%22math11b25dfe6f3d795a3d24c0528e8%22%20font-size%3D%2216%22%20text-anchor%3D%22middle%22%20x%3D%2218.5%22%20y%3D%2217%22%3E%3D%3C%2Ftext%3E%3Ctext%20font-family%3D%22math11b25dfe6f3d795a3d24c0528e8%22%20font-size%3D%2216%22%20text-anchor%3D%22middle%22%20x%3D%2235.5%22%20y%3D%2217%22%3E%26%23xB1%3B%3C%2Ftext%3E%3Ctext%20font-family%3D%22Times%20New%20Roman%22%20font-size%3D%2218%22%20font-style%3D%22italic%22%20text-anchor%3D%22middle%22%20x%3D%2247.5%22%20y%3D%2217%22%3Ex%3C%2Ftext%3E%3Ctext%20font-family%3D%22Times%20New%20Roman%22%20font-size%3D%2213%22%20text-anchor%3D%22middle%22%20x%3D%2256.5%22%20y%3D%2212%22%3E2%3C%2Ftext%3E%3C%2Fsvg%3E) )
) - cubic (
format('truetype')%3Bfont-weight%3Anormal%3Bfont-style%3Anormal%3B%7D%3C%2Fstyle%3E%3C%2Fdefs%3E%3Ctext%20font-family%3D%22Times%20New%20Roman%22%20font-size%3D%2218%22%20font-style%3D%22italic%22%20text-anchor%3D%22middle%22%20x%3D%224.5%22%20y%3D%2217%22%3Ey%3C%2Ftext%3E%3Ctext%20font-family%3D%22math11b25dfe6f3d795a3d24c0528e8%22%20font-size%3D%2216%22%20text-anchor%3D%22middle%22%20x%3D%2218.5%22%20y%3D%2217%22%3E%3D%3C%2Ftext%3E%3Ctext%20font-family%3D%22math11b25dfe6f3d795a3d24c0528e8%22%20font-size%3D%2216%22%20text-anchor%3D%22middle%22%20x%3D%2235.5%22%20y%3D%2217%22%3E%26%23xB1%3B%3C%2Ftext%3E%3Ctext%20font-family%3D%22Times%20New%20Roman%22%20font-size%3D%2218%22%20font-style%3D%22italic%22%20text-anchor%3D%22middle%22%20x%3D%2247.5%22%20y%3D%2217%22%3Ex%3C%2Ftext%3E%3Ctext%20font-family%3D%22Times%20New%20Roman%22%20font-size%3D%2213%22%20text-anchor%3D%22middle%22%20x%3D%2256.5%22%20y%3D%2212%22%3E3%3C%2Ftext%3E%3C%2Fsvg%3E) )
) - reciprocal (
format('truetype')%3Bfont-weight%3Anormal%3Bfont-style%3Anormal%3B%7D%3C%2Fstyle%3E%3C%2Fdefs%3E%3Ctext%20font-family%3D%22Times%20New%20Roman%22%20font-size%3D%2218%22%20font-style%3D%22italic%22%20text-anchor%3D%22middle%22%20x%3D%224.5%22%20y%3D%2230%22%3Ey%3C%2Ftext%3E%3Ctext%20font-family%3D%22math11b25dfe6f3d795a3d24c0528e8%22%20font-size%3D%2216%22%20text-anchor%3D%22middle%22%20x%3D%2218.5%22%20y%3D%2230%22%3E%3D%3C%2Ftext%3E%3Ctext%20font-family%3D%22math11b25dfe6f3d795a3d24c0528e8%22%20font-size%3D%2216%22%20text-anchor%3D%22middle%22%20x%3D%2235.5%22%20y%3D%2230%22%3E%26%23xB1%3B%3C%2Ftext%3E%3Cline%20stroke%3D%22%23000000%22%20stroke-linecap%3D%22square%22%20stroke-width%3D%221%22%20x1%3D%2245.5%22%20x2%3D%2258.5%22%20y1%3D%2223.5%22%20y2%3D%2223.5%22%2F%3E%3Ctext%20font-family%3D%22Times%20New%20Roman%22%20font-size%3D%2218%22%20text-anchor%3D%22middle%22%20x%3D%2252.5%22%20y%3D%2216%22%3E1%3C%2Ftext%3E%3Ctext%20font-family%3D%22Times%20New%20Roman%22%20font-size%3D%2218%22%20font-style%3D%22italic%22%20text-anchor%3D%22middle%22%20x%3D%2251.5%22%20y%3D%2241%22%3Ex%3C%2Ftext%3E%3C%2Fsvg%3E) )
) - exponential (
format('truetype')%3Bfont-weight%3Anormal%3Bfont-style%3Anormal%3B%7D%3C%2Fstyle%3E%3C%2Fdefs%3E%3Ctext%20font-family%3D%22Times%20New%20Roman%22%20font-size%3D%2218%22%20font-style%3D%22italic%22%20text-anchor%3D%22middle%22%20x%3D%224.5%22%20y%3D%2217%22%3Ey%3C%2Ftext%3E%3Ctext%20font-family%3D%22math11b25dfe6f3d795a3d24c0528e8%22%20font-size%3D%2216%22%20text-anchor%3D%22middle%22%20x%3D%2218.5%22%20y%3D%2217%22%3E%3D%3C%2Ftext%3E%3Ctext%20font-family%3D%22Times%20New%20Roman%22%20font-size%3D%2218%22%20font-style%3D%22italic%22%20text-anchor%3D%22middle%22%20x%3D%2231.5%22%20y%3D%2217%22%3Ek%3C%2Ftext%3E%3Ctext%20font-family%3D%22math11b25dfe6f3d795a3d24c0528e8%22%20font-size%3D%2212%22%20text-anchor%3D%22middle%22%20x%3D%2241.5%22%20y%3D%2212%22%3E%26%23xB1%3B%3C%2Ftext%3E%3Ctext%20font-family%3D%22Times%20New%20Roman%22%20font-size%3D%2213%22%20font-style%3D%22italic%22%20text-anchor%3D%22middle%22%20x%3D%2249.5%22%20y%3D%2212%22%3Ex%3C%2Ftext%3E%3C%2Fsvg%3E) )
)
- linear (
- You may also need to recognise the shapes of the graphs
and

Exam Question
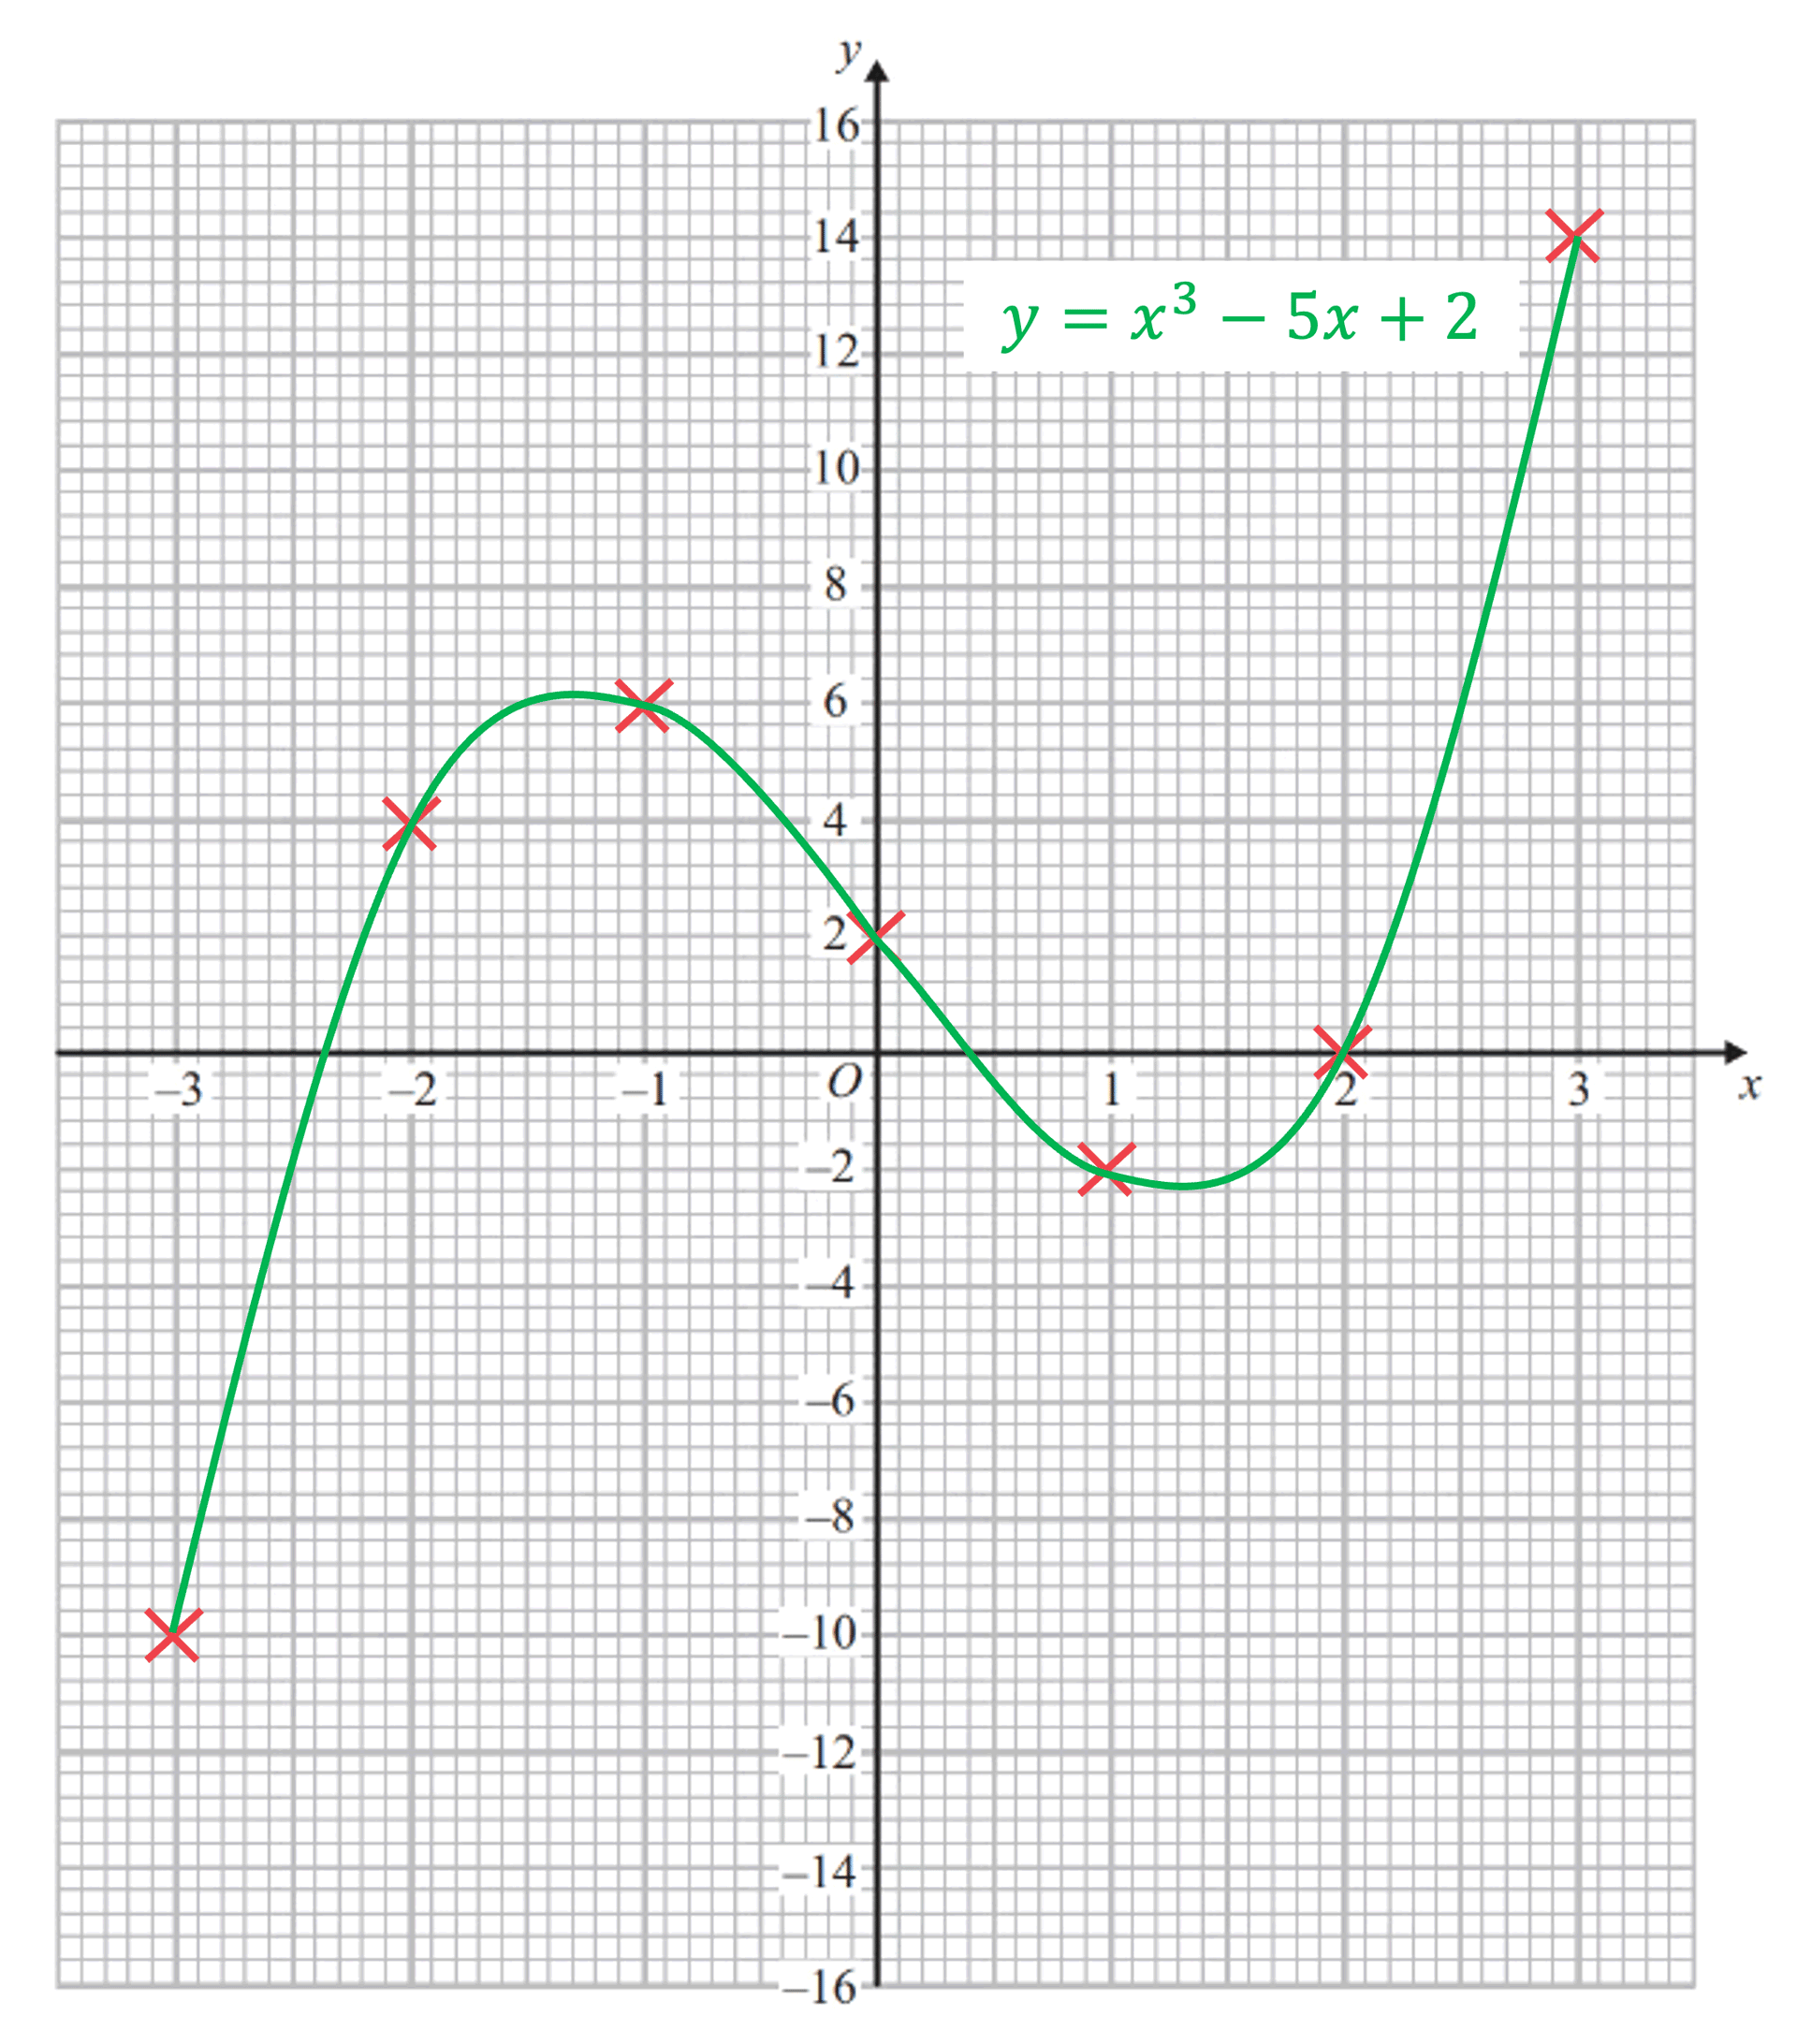
Complete the table of values for the function format('truetype')%3Bfont-weight%3Anormal%3Bfont-style%3Anormal%3B%7D%3C%2Fstyle%3E%3C%2Fdefs%3E%3Ctext%20font-family%3D%22Times%20New%20Roman%22%20font-size%3D%2218%22%20font-style%3D%22italic%22%20text-anchor%3D%22middle%22%20x%3D%224.5%22%20y%3D%2217%22%3Ey%3C%2Ftext%3E%3Ctext%20font-family%3D%22math190bc3972c7934354efb2af01e7%22%20font-size%3D%2216%22%20text-anchor%3D%22middle%22%20x%3D%2218.5%22%20y%3D%2217%22%3E%3D%3C%2Ftext%3E%3Ctext%20font-family%3D%22Times%20New%20Roman%22%20font-size%3D%2218%22%20font-style%3D%22italic%22%20text-anchor%3D%22middle%22%20x%3D%2231.5%22%20y%3D%2217%22%3Ex%3C%2Ftext%3E%3Ctext%20font-family%3D%22Times%20New%20Roman%22%20font-size%3D%2213%22%20text-anchor%3D%22middle%22%20x%3D%2240.5%22%20y%3D%2212%22%3E3%3C%2Ftext%3E%3Ctext%20font-family%3D%22math190bc3972c7934354efb2af01e7%22%20font-size%3D%2216%22%20text-anchor%3D%22middle%22%20x%3D%2252.5%22%20y%3D%2217%22%3E%26%23x2212%3B%3C%2Ftext%3E%3Ctext%20font-family%3D%22Times%20New%20Roman%22%20font-size%3D%2218%22%20text-anchor%3D%22middle%22%20x%3D%2265.5%22%20y%3D%2217%22%3E5%3C%2Ftext%3E%3Ctext%20font-family%3D%22Times%20New%20Roman%22%20font-size%3D%2218%22%20font-style%3D%22italic%22%20text-anchor%3D%22middle%22%20x%3D%2274.5%22%20y%3D%2217%22%3Ex%3C%2Ftext%3E%3Ctext%20font-family%3D%22math190bc3972c7934354efb2af01e7%22%20font-size%3D%2216%22%20text-anchor%3D%22middle%22%20x%3D%2288.5%22%20y%3D%2217%22%3E%2B%3C%2Ftext%3E%3Ctext%20font-family%3D%22Times%20New%20Roman%22%20font-size%3D%2218%22%20text-anchor%3D%22middle%22%20x%3D%22101.5%22%20y%3D%2217%22%3E2%3C%2Ftext%3E%3C%2Fsvg%3E) . and plot the Graph using those coordinates
. and plot the Graph using those coordinates
| x | -3 | -2 | -1 | 0 | 1 | 2 | 3 |
| y | 4 | 14 |
ANSWER
If you have a scientefic calculator use the table function
TO MANUALLY CALCULATE use the following steps
for example for x = -3 column to find y you have to put/substitute -3 where there is x in the equation as shown below
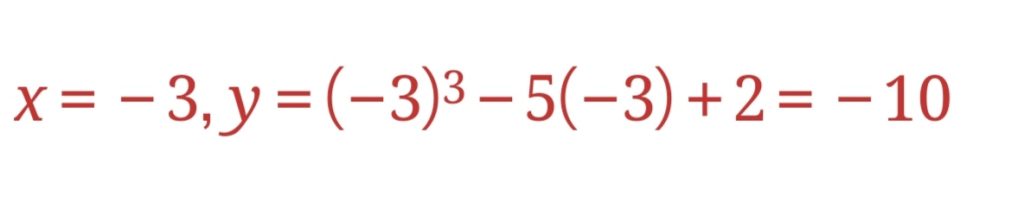
use the same method for all x values to calculate your y values. Below is the completed table
| x | -3 | -2 | -1 | 0 | 1 | 2 | 3 |
| y | -10 | 4 | 6 | 2 | -2 | 0 | 14 |
Plot the graph using your table as shown below